Exploratory Data Analysis of Cell Phone Usage with R: Part 1
In this post, we will analyze data from my cell phone provider on my phone usage. The data contain information on my mobile data use, phone calls, and text messages. We will use exploratory data analysis to understand how my phone usage varies across the hours of the day, and examine whether the way I use my phone differs between weekdays and weekends.
The Data
The data come from Excel files that I regularly receive from my employer. The Excel files provide a detailed summary of my phone usage. The idea is that I should be aware of my cell phone use, because the company is paying the bill (thanks!).
The cleaned and formatted data we will analyze are available in this Github Repository, along with the code presented in this blog post.
The format of the data is as follows. For every hour of every day for the entire period for which the data were recorded, the file contains information detailing when I did one of three things with my phone: sent a text message, made a phone call (outgoing calls only), and used mobile data. The first observation is on 2018-01-19, and the last observation is on 2019-09-06, for a total of 548 unique days and 13,372 lines of data.
The first 10 rows of the data look like this:
library(knitr)
head(full_data, 10) %>%
kable("html", align= 'c') | oneday | hour | call_type | n | data_usage_kb | dow | week_weekend |
|---|---|---|---|---|---|---|
| 2018-01-19 | 0 | NA | NA | NA | Fri | Weekday |
| 2018-01-19 | 1 | NA | NA | NA | Fri | Weekday |
| 2018-01-19 | 2 | NA | NA | NA | Fri | Weekday |
| 2018-01-19 | 3 | NA | NA | NA | Fri | Weekday |
| 2018-01-19 | 4 | NA | NA | NA | Fri | Weekday |
| 2018-01-19 | 5 | NA | NA | NA | Fri | Weekday |
| 2018-01-19 | 6 | NA | NA | NA | Fri | Weekday |
| 2018-01-19 | 7 | NA | NA | NA | Fri | Weekday |
| 2018-01-19 | 8 | NA | NA | NA | Fri | Weekday |
| 2018-01-19 | 9 | Phone Call | 1 | 0 | Fri | Weekday |
dim(full_data)## [1] 13372 7It looks like I made a phone call at 9 AM on Friday January 19th, 2018.
Data Visualization
All Usage Types Across Hours of the Day
Let’s first plot out all types of phone usage throughout the day, using colors to visualize the different usage types (mobile data usage, phone calls and text messages).
# load the libraries we'll need

library(ggplot2)
library(RColorBrewer)
library(plyr); library(dplyr)

# Hexadecimal color specification

color_palette <- brewer.pal(n = 3, name = "Dark2")

# set up the x-axis labels

x_axis_labels = seq(from = 0, to = 23, by = 1)

# plot all types of phone usage throughout the course of the day

full_data %>% filter(!is.na(call_type)) %>% # remove observations for which no usage was recorded

  # set up the plot basics

  ggplot(aes(x = hour, y = n, fill = call_type)) +
  # we want a bar chart

  geom_bar(stat = 'identity') +
  # set the labels

  labs(x = "Hour of Day", y = "Total", title = 'Phone Usage Across the Day' ) +
  # we want continuous tick marks for every hour of the day

  # the code below uses the x_axis_labels we set up above to achieve this

  scale_x_continuous(labels = x_axis_labels, breaks = x_axis_labels) +
  # set the legend title and specify the colors we define above

  # with the color palette (from R Color Brewer)

  scale_fill_manual(name = "Usage Type", values=color_palette)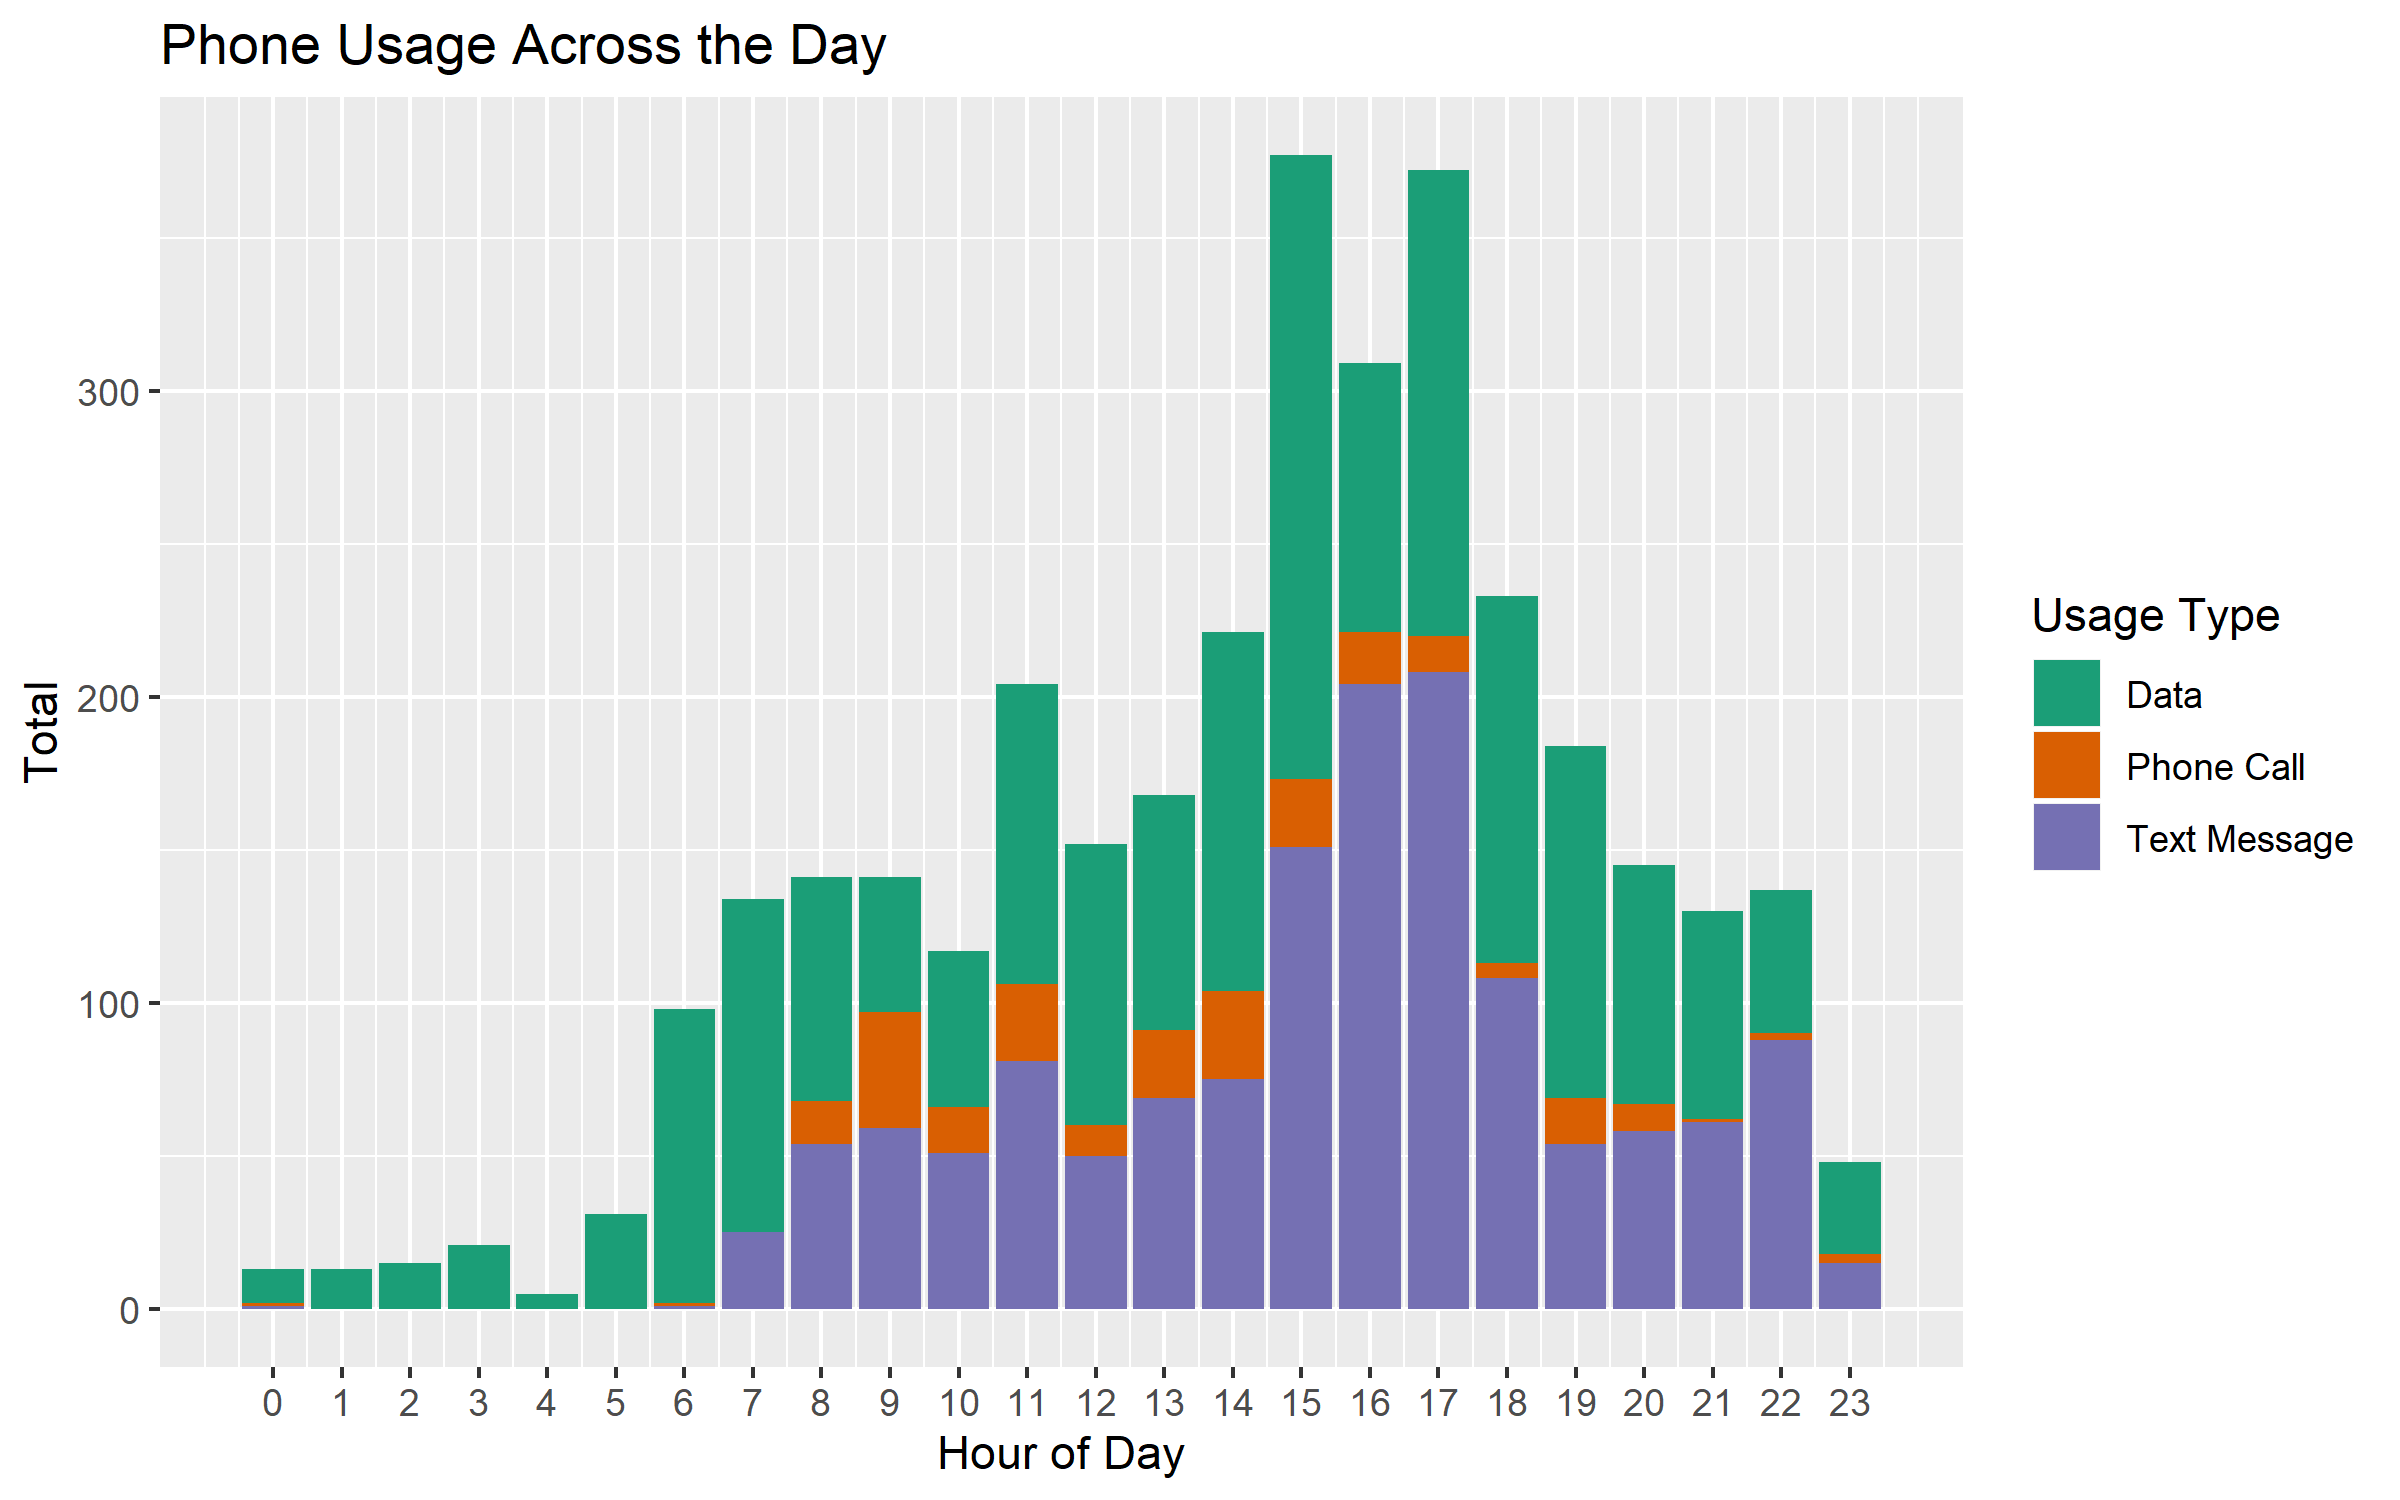
This plot is interesting, and it definitely gives a sense of when I’m using my phone! It looks like my usage typically starts around 6 AM. It is relatively steady until 2PM, at which point it increases, reaching its highest levels at 3 and 5 PM. From 6 PM onwards, my phone usage slowly decreases, and at 11 PM, I’m usually not using my phone very much.
The advantage of this way of looking at the data is that it allows us to see the activity aggregated across types of usage and hour of the day. However, it’s hard to get a sense of the patterns of mobile data usage and phone calls, because they are shown above the text message data, and therefore don’t have a common starting point on the y-axis.
Let’s separate out the plots by phone usage type. This will allow us to get a better sense of the patterns for the different usage types throughout the day.
# make separate facets for each type of usage

full_data %>% filter(!is.na(call_type)) %>%
  ggplot(aes(x = hour, y = n, fill = call_type)) +
  geom_bar(stat = 'identity') +
  labs(x = "Hour of Day", y = "Total", title = 'Phone Usage by Type Across the Day' )  +
  scale_x_continuous(labels = x_axis_labels, breaks = x_axis_labels) +
  scale_fill_manual(name = "Usage Type", values=color_palette) +
  facet_grid(call_type ~ .)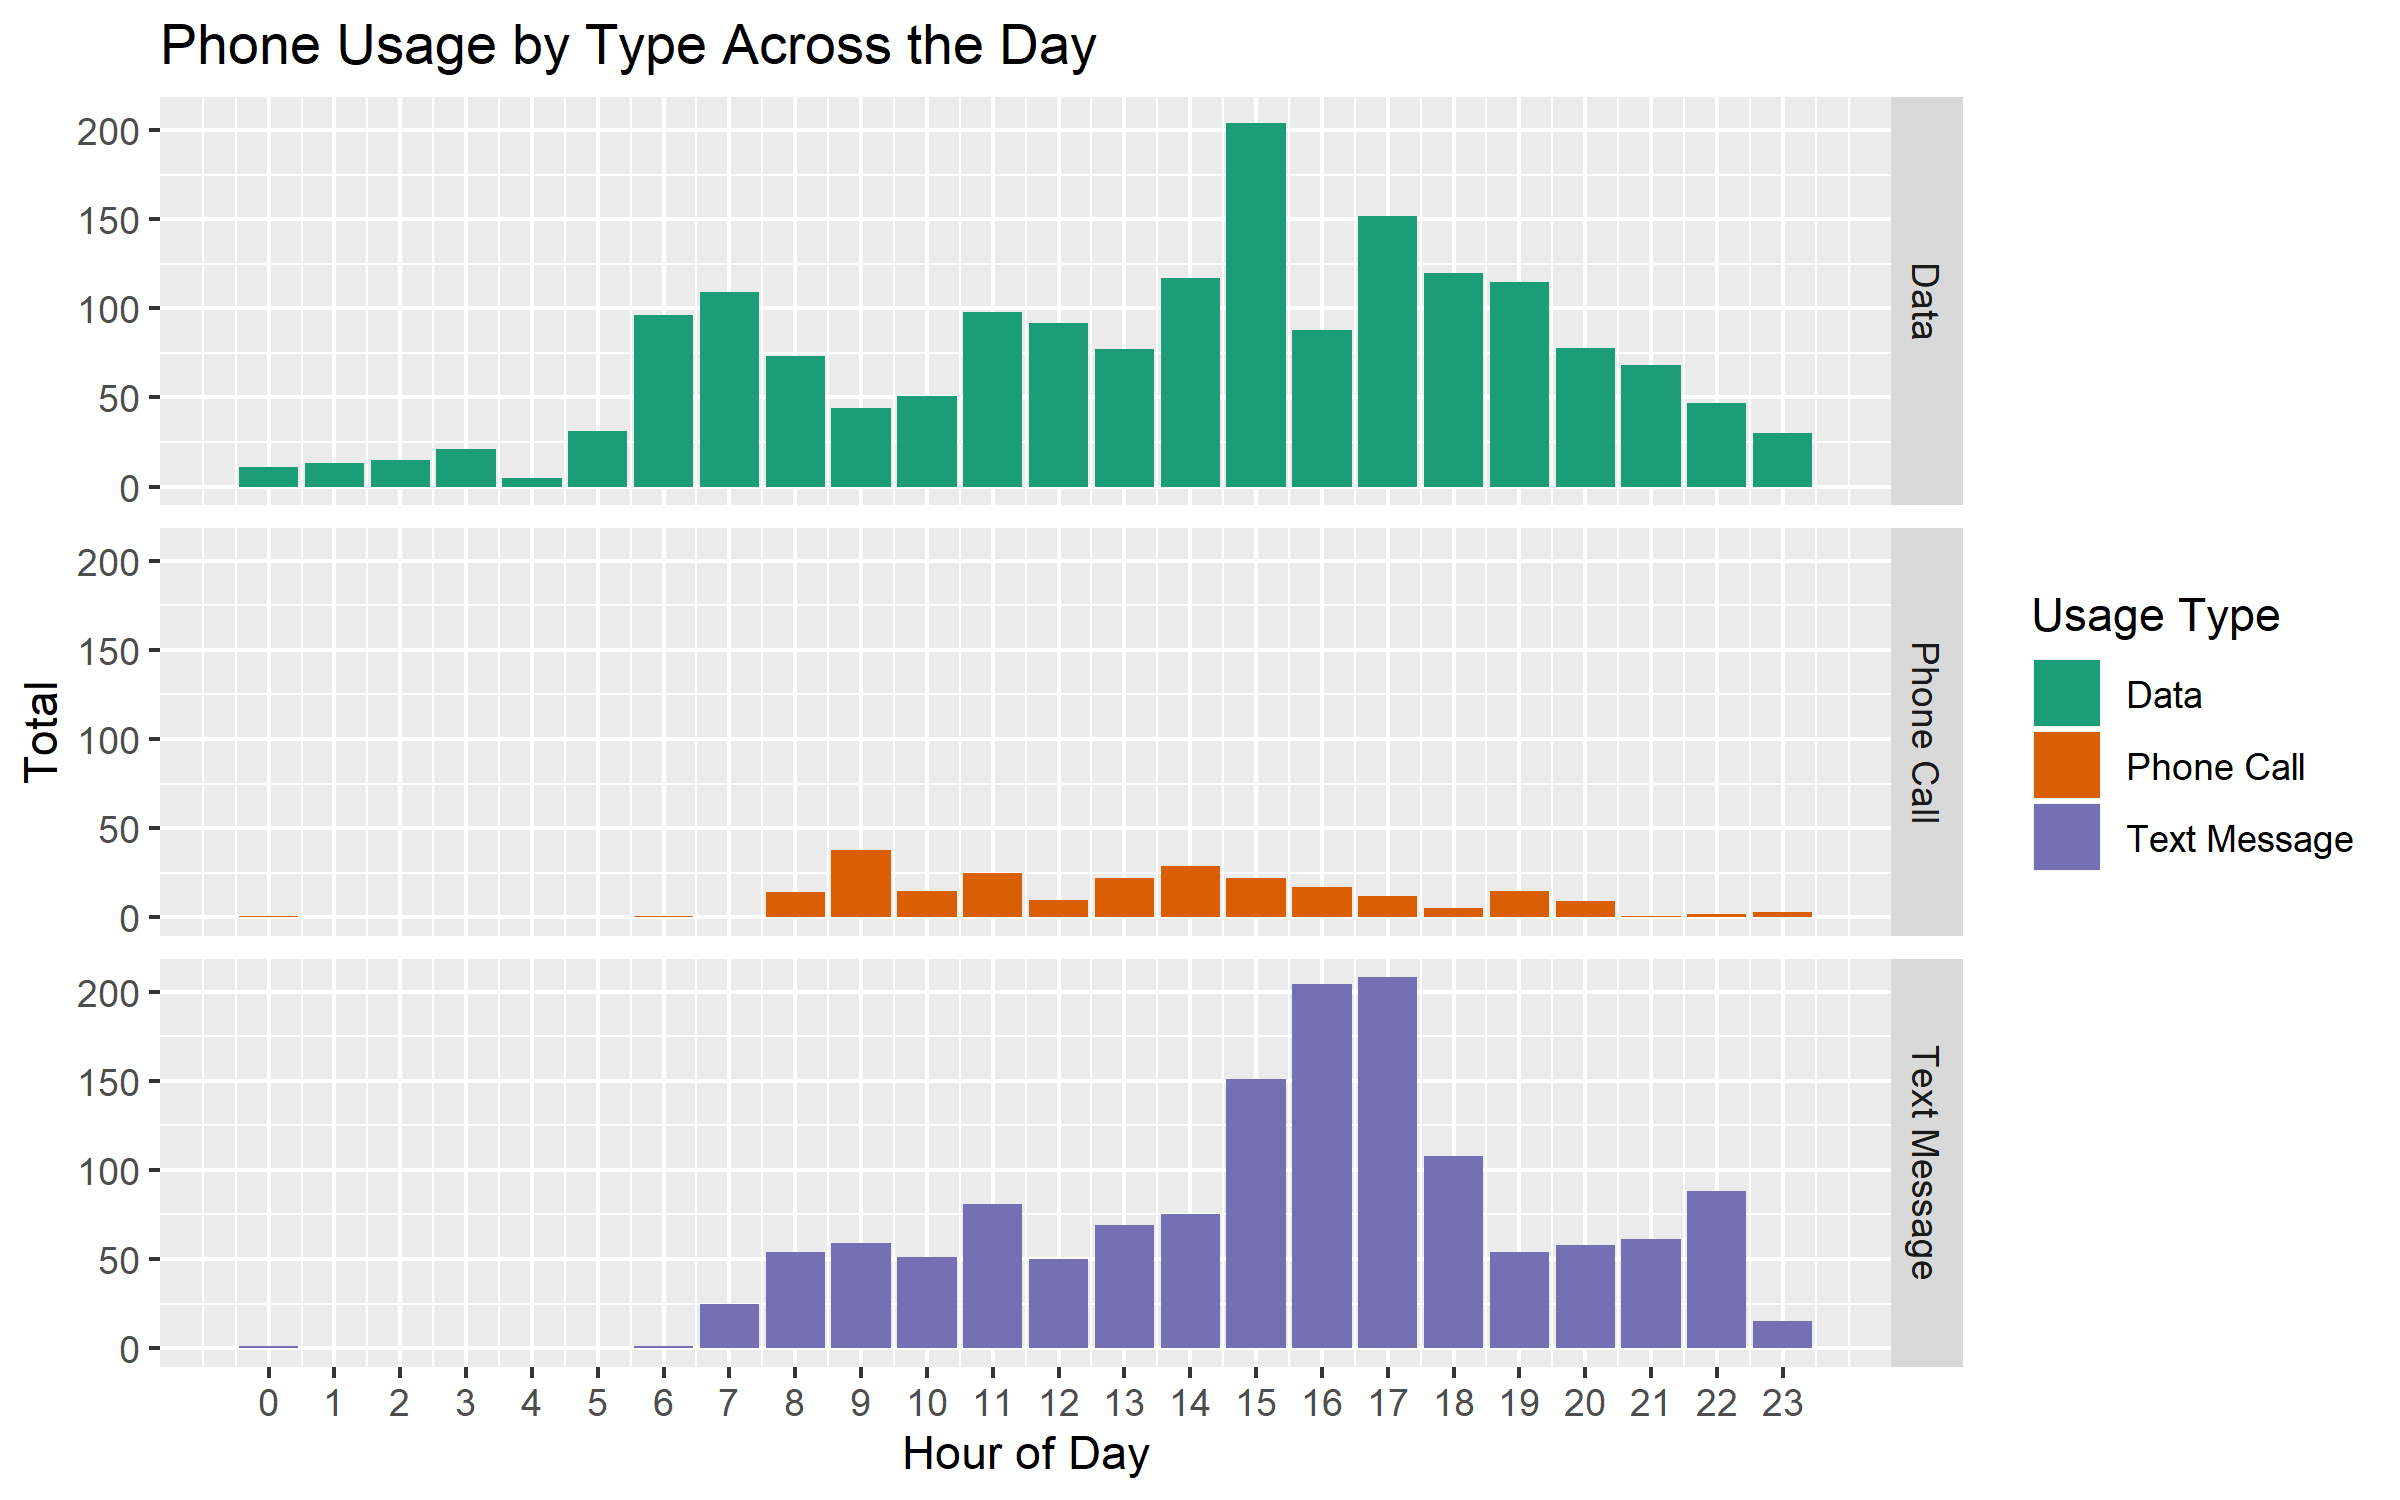
This graph makes it clear that I make far fewer phone calls, compared to the amount of times I use mobile data or send text messages. This is definitely the case! Who makes phone calls anymore?
Other patterns of note are peaks of mobile data usage between 6 and 7 AM and at 3 PM, and peaks of text messaging between 3 and 5 PM. We’ll explore these patterns in more detail in the analysis below.
Weekday vs. Weekend Differences
Let’s now separate out the results for weekdays versus the weekends. I know from analyzing my step count data that my walking behavior is very different during the weekdays vs. the weekends. I was curious to see whether the same was true for how I use my phone.
Let’s first plot out the results for all of the different usage types, making separate plots for the weekdays and weekends.
# analyze patterns by week / weekend

full_data %>% filter(!is.na(call_type)) %>%
  ggplot(aes(x = hour, y = n, fill = call_type)) +
  geom_bar(stat = 'identity') +
  labs(x = "Hour of Day", y = "Total", title = 'Phone Usage by Type Across Day' )  +
  scale_x_continuous(labels = x_axis_labels, breaks = x_axis_labels) +
  scale_fill_manual(name = "Usage Type", values=color_palette) +
  facet_grid(week_weekend ~ .)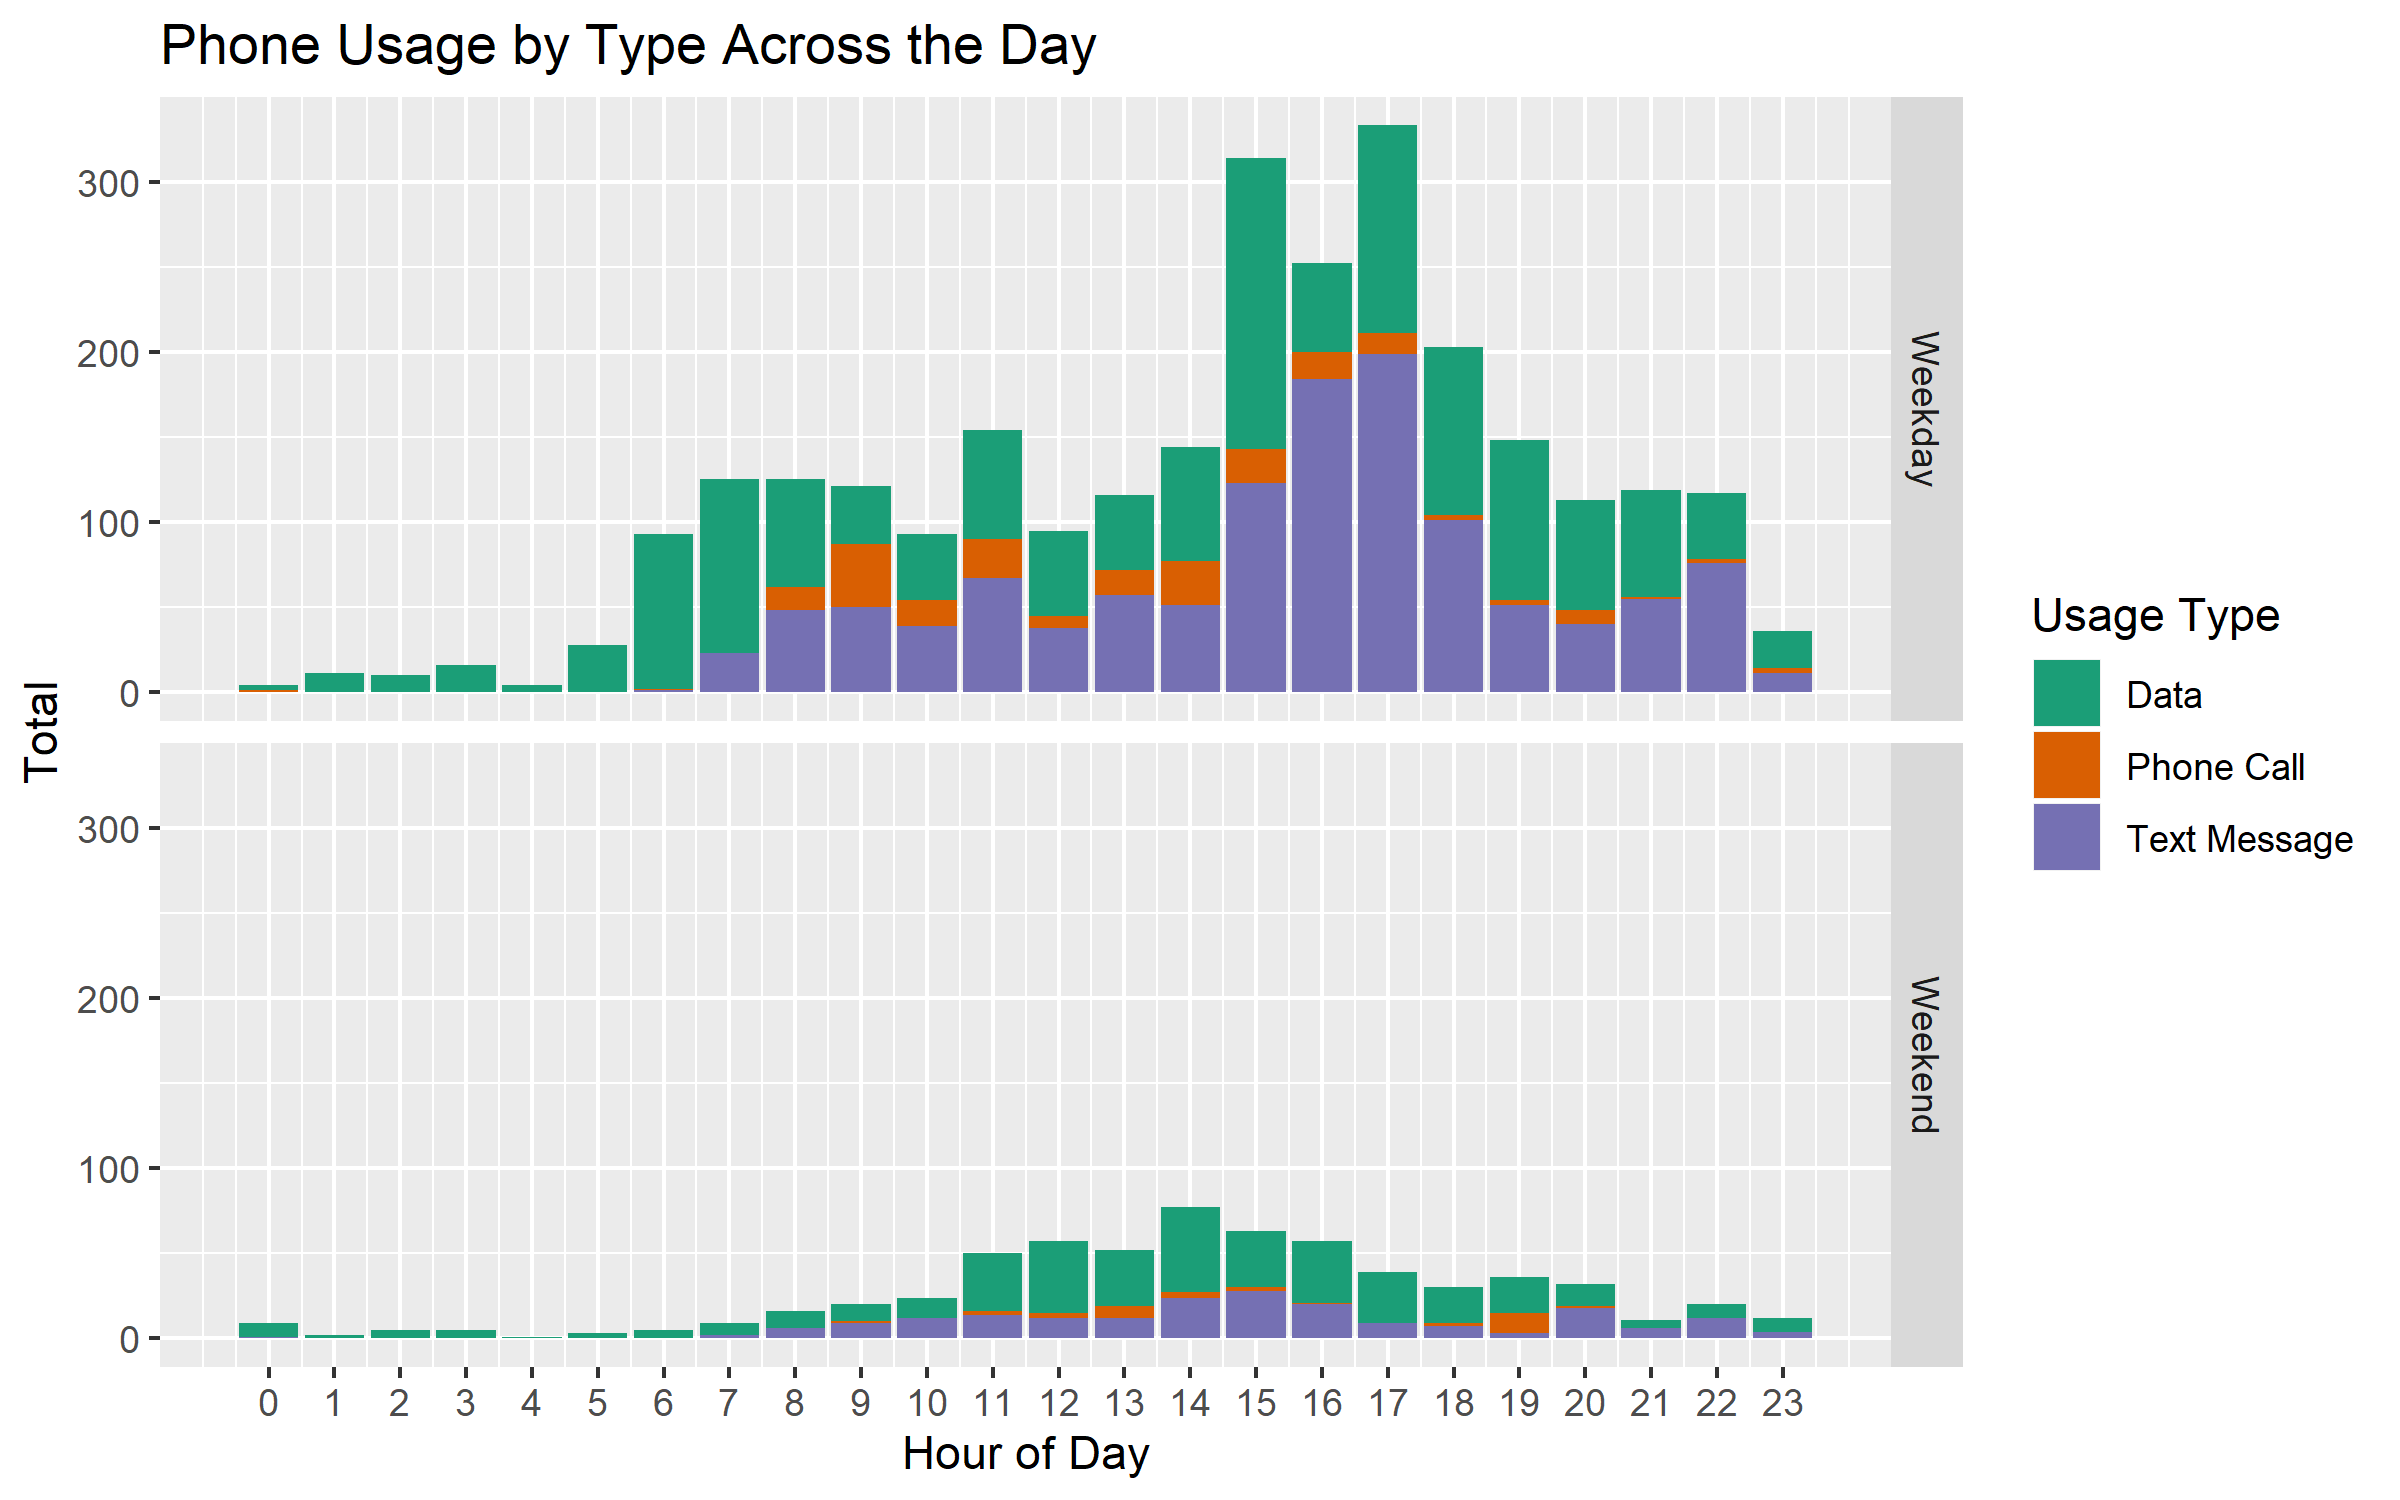
The patterns for weekdays are more similar to the overall pattern, but this shouldn’t be so surprising. After all, there are many more weekdays than weekends in the data, and so the weekday pattern dominates in the dataset as a whole.
Interestingly, the patterns of phone usage are quite different across these two different types of days. On the weekdays, the total number of phone uses is relatively constant from 7 AM to 2 PM, followed by large peaks from 3 to 5 PM. From 6 PM to 10 PM, usage is fairly constant, falling sharply at 11 PM. On weekends, we observe a fairly normal distribution of phone usages, with a single small peak at 2 PM.
Let’s do a deep-dive on each type of phone usage, examining the patterns of use on weekdays versus weekends.
Mobile Data
The code to make the plot of the mobile data values is as follows:
# data by week/weekend

full_data %>% filter(!is.na(call_type) & call_type == 'Data') %>%
  ggplot(aes(x = hour, y = n, fill = call_type)) +
  geom_bar(stat = 'identity') +
  labs(x = "Hour of Day", y = "Total", title = 'Data Usage Across the Day: Weekdays vs. Weekends' )  +
  scale_x_continuous(labels = x_axis_labels, breaks = x_axis_labels) +
  scale_fill_manual(name = "Usage Type", values=color_palette[1]) +
  facet_grid(week_weekend ~ .)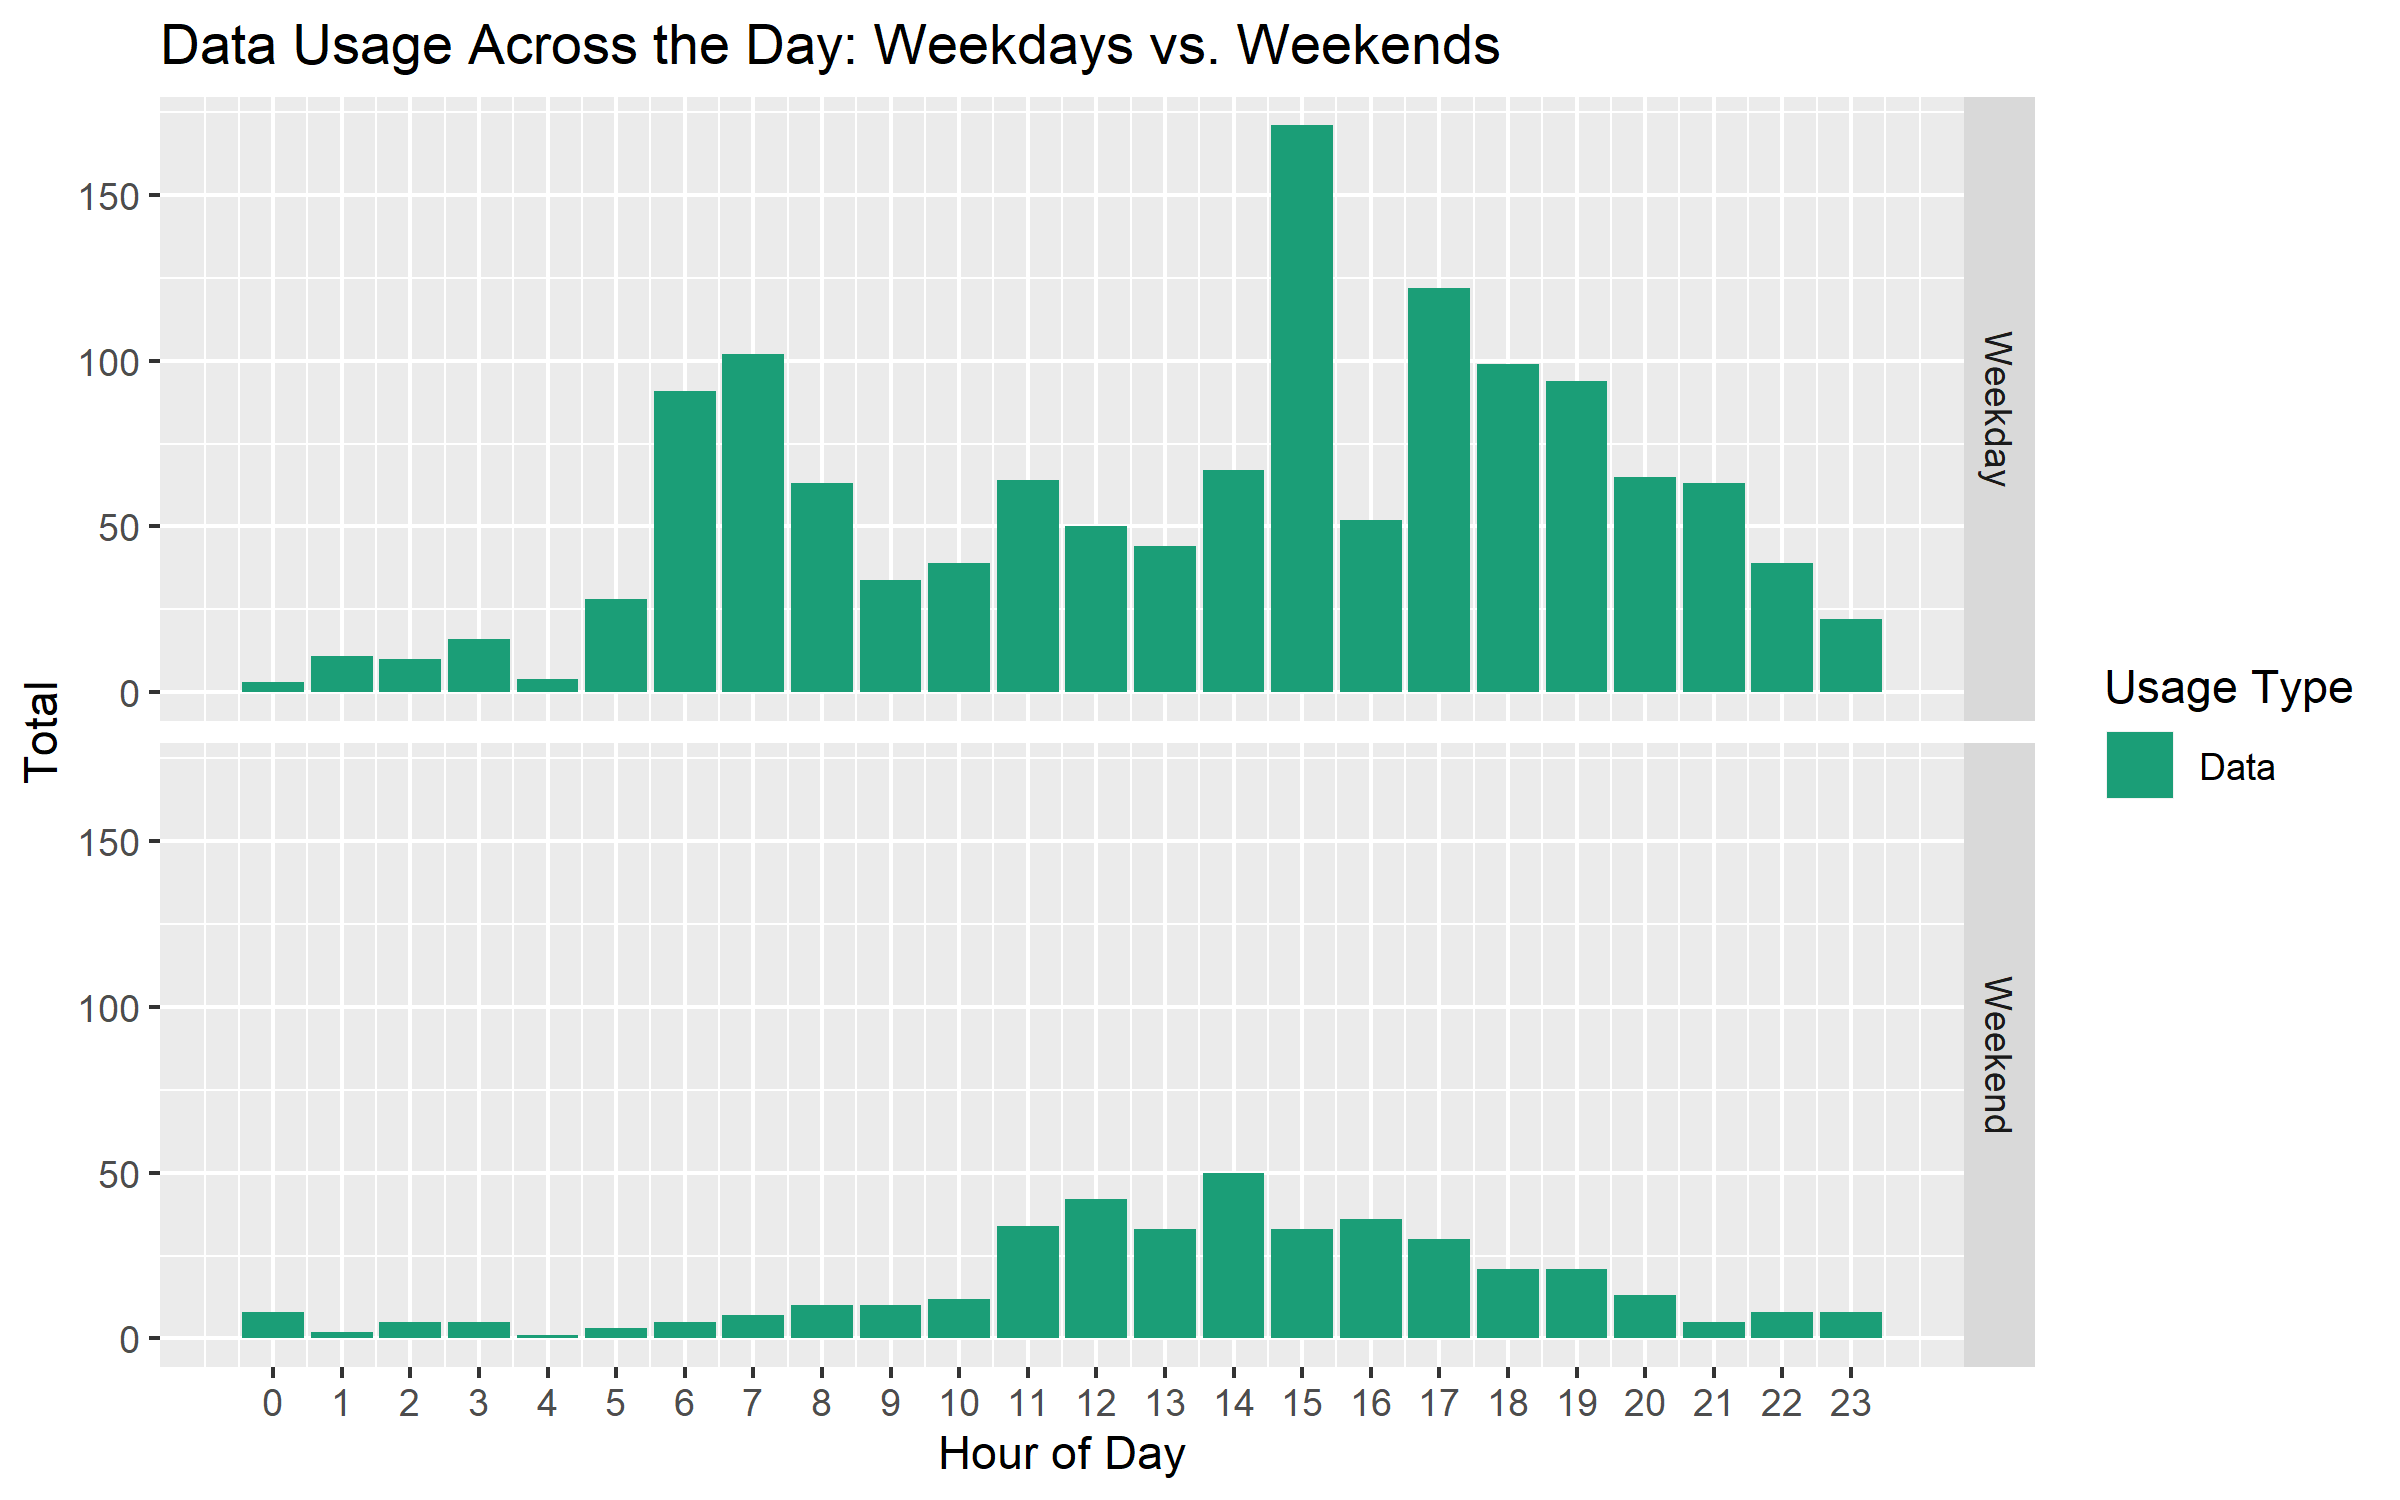
During the weekdays, we can clearly see my use of mobile internet for Google Maps during my morning and afternoon commutes. I leave relatively early between 6 and 7 and often return home relatively early at around 3 PM (though sometimes return between 5 and 7 PM, as suggested by the figures in the graph.)
During the weekends, the usage is relatively normally distributed, with a slight peak at 2 PM.
It’s interesting to notice that there are observations of data usage at every single hour of the day on both weekdays and weekends. As we will see, this is not the case with the other types of phone usage!
Phone Calls
Next, let’s take a look at the data for phone calls.
# phone calls by week/weekend

full_data %>% filter(!is.na(call_type) & call_type == 'Phone Call') %>%
  ggplot(aes(x = hour, y = n, fill = call_type)) +
  geom_bar(stat = 'identity') +
  labs(x = "Hour of Day", y = "Total", title = 'Phone Calls Across the Day: Weekdays vs. Weekends' )  +
  scale_x_continuous(labels = x_axis_labels, breaks = x_axis_labels) +
  scale_fill_manual(name = "Usage Type", values=color_palette[2]) +
  facet_grid(week_weekend ~ .)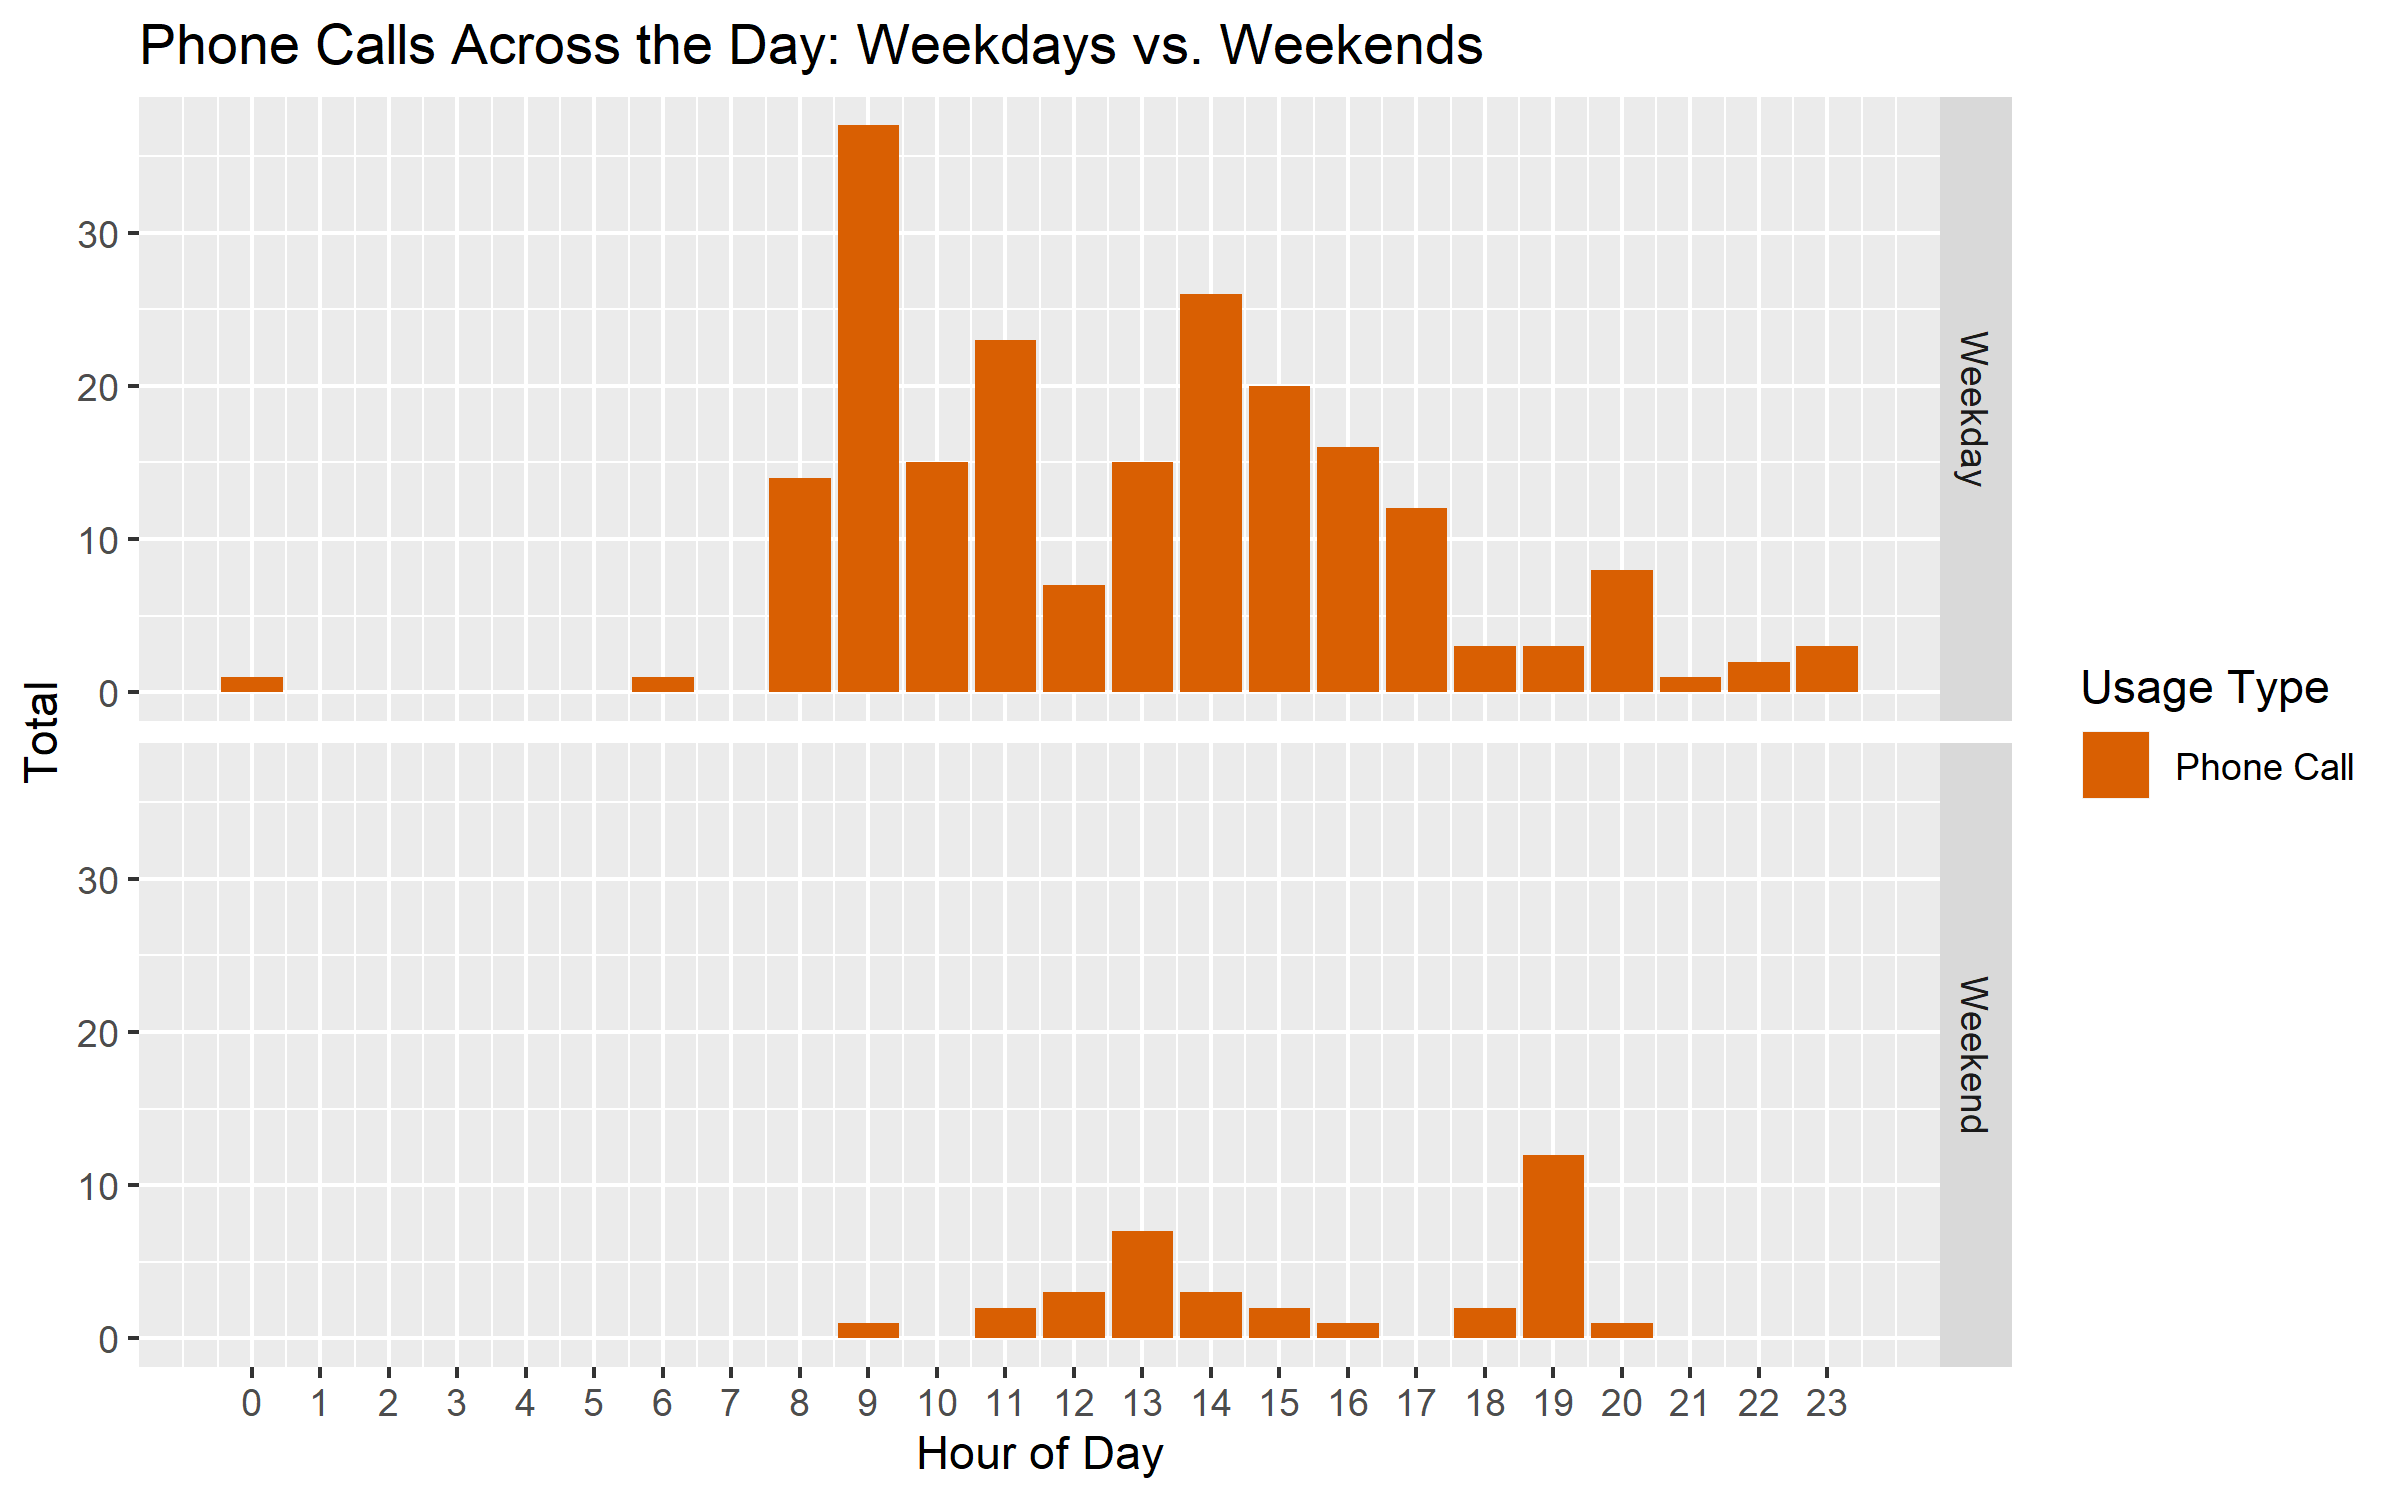
During the weekdays, I make the most phone calls at 9 AM. This was somewhat surprising to me. My guess is that I’m calling people for work at the beginning of normal office hours. The rate of calling during the weekdays takes a dip during lunchtime, but is relatively constant up until 5 PM. It drops off fairly sharply from 6 PM onwards. When I’m calling people, it looks like, it’s mostly for work!
During the weekends, there is a somewhat normal distribution from 11 AM to 4 PM, with a small peak at 1 PM. The thing that jumps out the most is the relatively large value of calls at 7 PM. This is also surprising to me, though it’s only 12 phone calls over the course of 1.5 years, so not a huge difference in the end.
On both weekdays and weekends, I hardly make any phone calls between midnight and 8 or 9 AM. Makes perfect sense - it’s hardly polite to call someone in the middle of the night or very early in the morning.
Text Messages
Finally, let’s take a look at my patterns of text messaging on the weekdays vs. weekends.
# text messages by week/weekend

full_data %>% filter(!is.na(call_type) & call_type == 'Text Message') %>% #head()

  ggplot(aes(x = hour, y = n, fill = call_type)) +
  geom_bar(stat = 'identity') +
  labs(x = "Hour of Day", y = "Total", title = 'Text Messages Across the Day: Weekdays vs. Weekends' )  +
  scale_x_continuous(labels = x_axis_labels, breaks = x_axis_labels) +
  scale_fill_manual(name = "Usage Type", values=color_palette[3]) +
  facet_grid(week_weekend ~ .)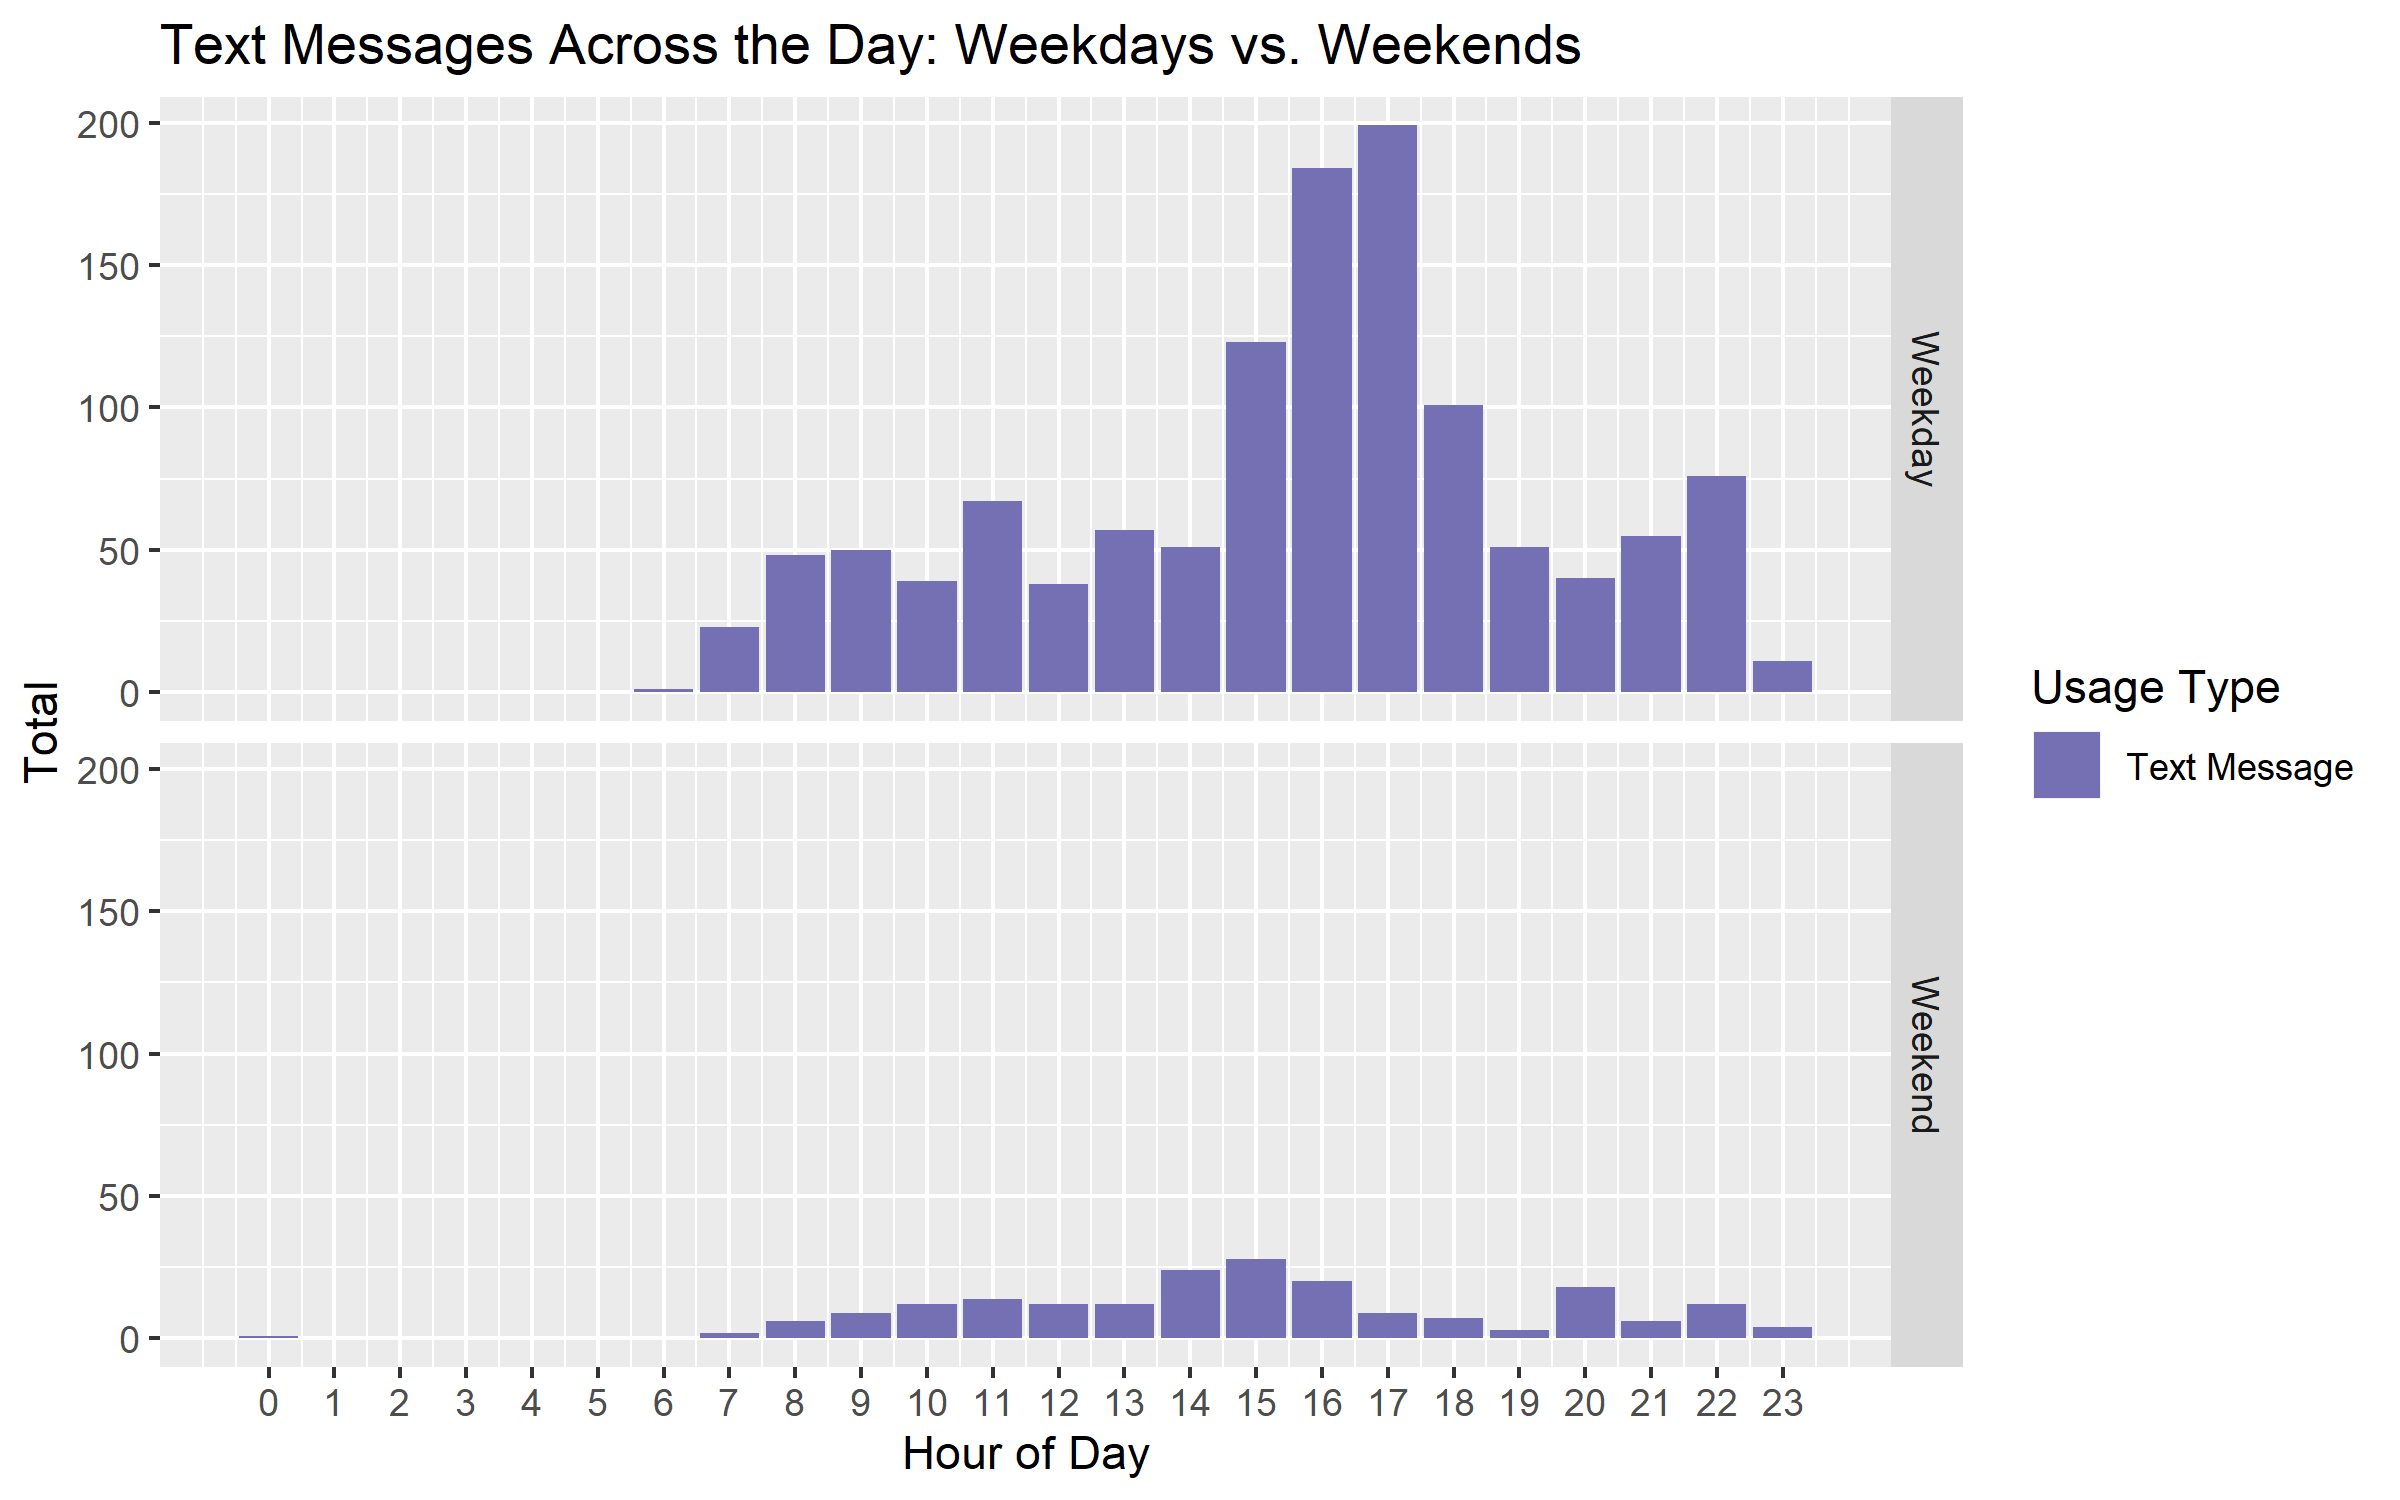
During the weekdays, it looks like there’s a large peak of text messages between 4 and 5 PM. Makes sense - I often text around this time to discuss evening parental activities.
During the weekends, there is a small peak around 3 PM, and again at 8 and 10 PM, but the differences are not enormous, and the peaks are much smaller than for weekdays.
As with text messages, I hardly text anyone between midnight and 8 AM. As with phone calls, I try to be polite and not disturb anyone in the middle of the night!
Caveats and Limitations
These data are interesting and seem to give a pretty good sense of the ways I use mobile data, make phone calls, and send text messages. However, the data do not detail all of the ways in which I use my phone. Firstly, these data don’t contain communications made via messaging apps, which I tend to use much more frequently than text messages. Second, these data only include uses that are potentially billable, so we are missing information on phone calls and text messages that I receive, and internet usage that takes place over wi-fi.
Nevertheless, the data contain complete information on some ways in which I use my phone, and the differences revealed through the data analysis confirmed some of my intuitions about phone use (e.g. peaks of mobile data when driving to work) and shed some light on patterns I had not previously considered (e.g. peaks of phone usage between 1 and 3 PM on the weekend). If the goal of exploratory data analysis is to learn and understand about patterns in the data, we have definitely succeeded here!
Summary and Conclusion
In this post, we analyzed data provided by my work on my phone usage. The data contained information on the amount of times I did one three things with my phone: 1) used mobile data, 2) made a phone call and 3) sent a text message.
The most striking pattern in the overall data is that my phone usage peaks between 3 and 5 PM. The analysis of the separate usage types by weekdays and weekends shed some more light on the global usage patterns. Mobile data use peaks during my commute times on weekdays - between 6 and 7 AM and around 3 PM. Phone calls happen most often during the weekdays at 9 AM. And text messages are most frequent between 4 and 5 PM on weekdays. The sum of these patterns of individual phone usage (particularly for mobile data and text messages) explain the global phone usage peaks between 3 and 5 PM!
Coming up next
In the next post, we’ll take a look at some other data in this dataset, and examine the amount of mobile data I used across the observed time period. I recently switched phone providers, and it was useful to have this information figure out which plan made sense for me.